PlanXcel Add-in
Enhance Efficiency: Seamless Visualization and Detailed Tracking in One Tool
The PlanXcel Add-in introduces a dedicated Ribbon Menu seamlessly integrated with Excel’s default menus. This custom ribbon offers all the essential tools to streamline project management and resource planning, enabling users to:
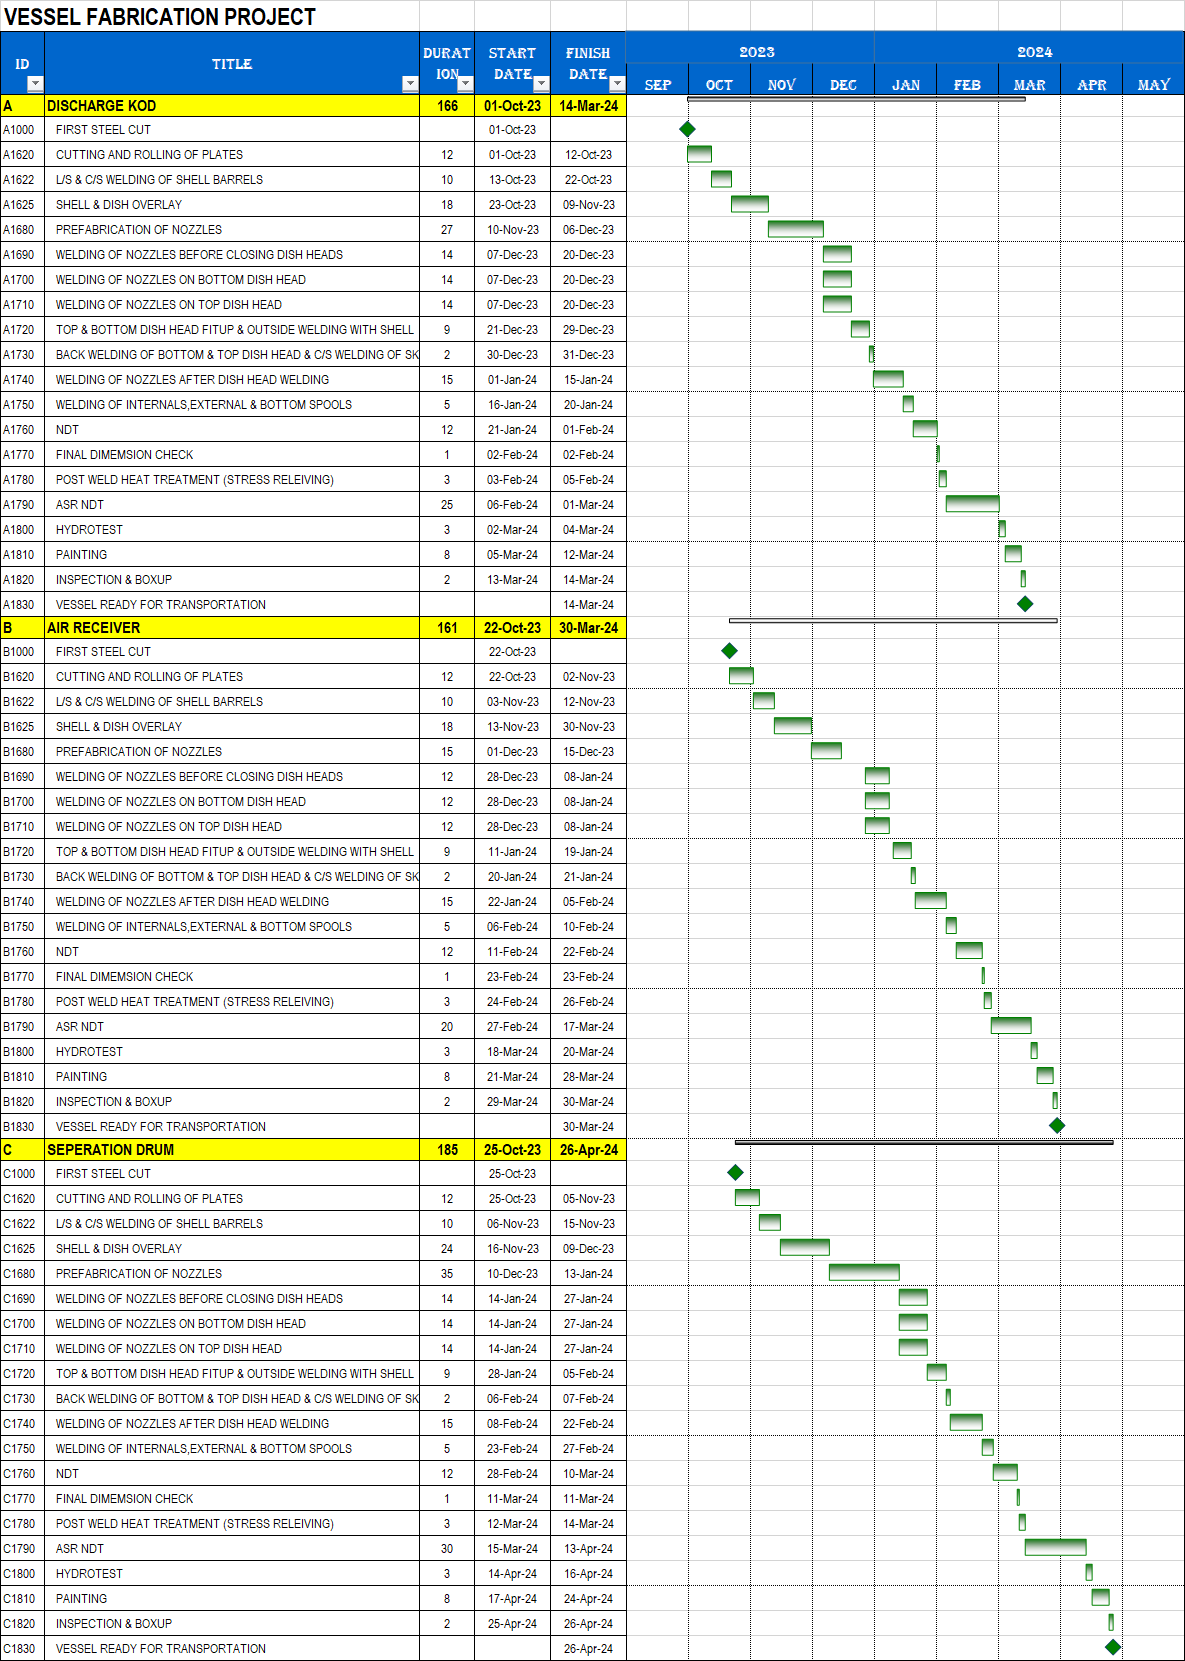
1. Bar Chart & Schedule Creation
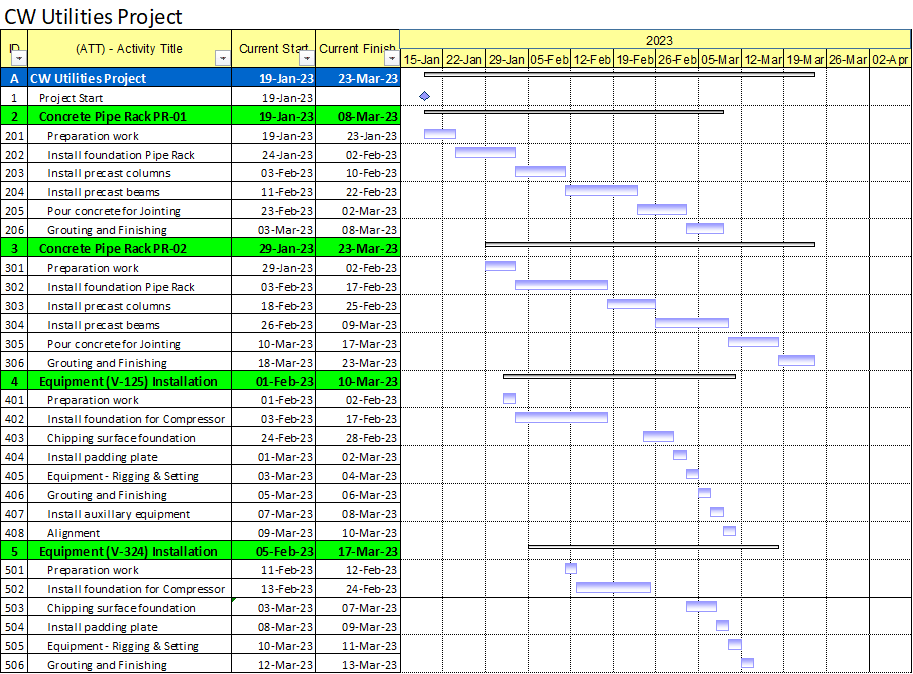
- Create dynamic bar charts to visualize activities and timelines.
- Customize charts for any project duration and calendar interval (daily, weekly, monthly, etc.).
- Define multiple calendars and assign them to specific tasks.
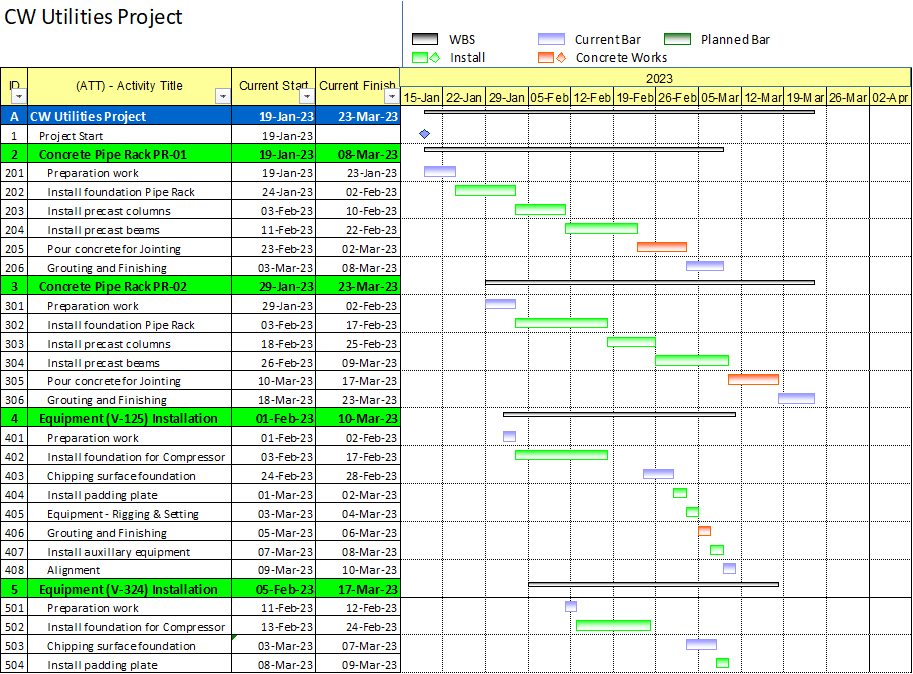
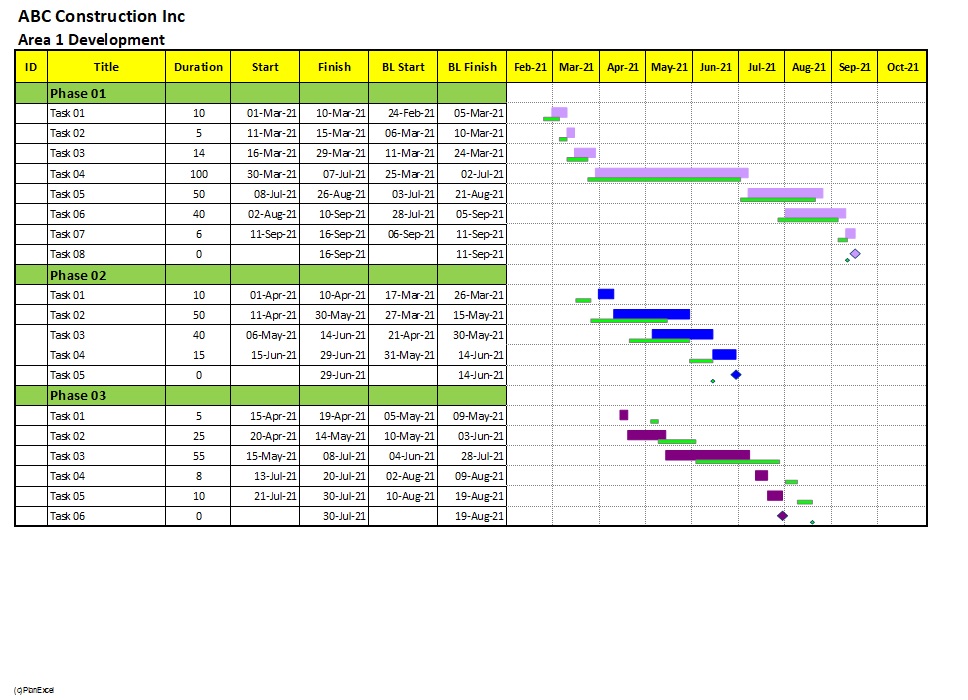
- Visualize dates comparisons and track variances effortlessly within the same workbook.
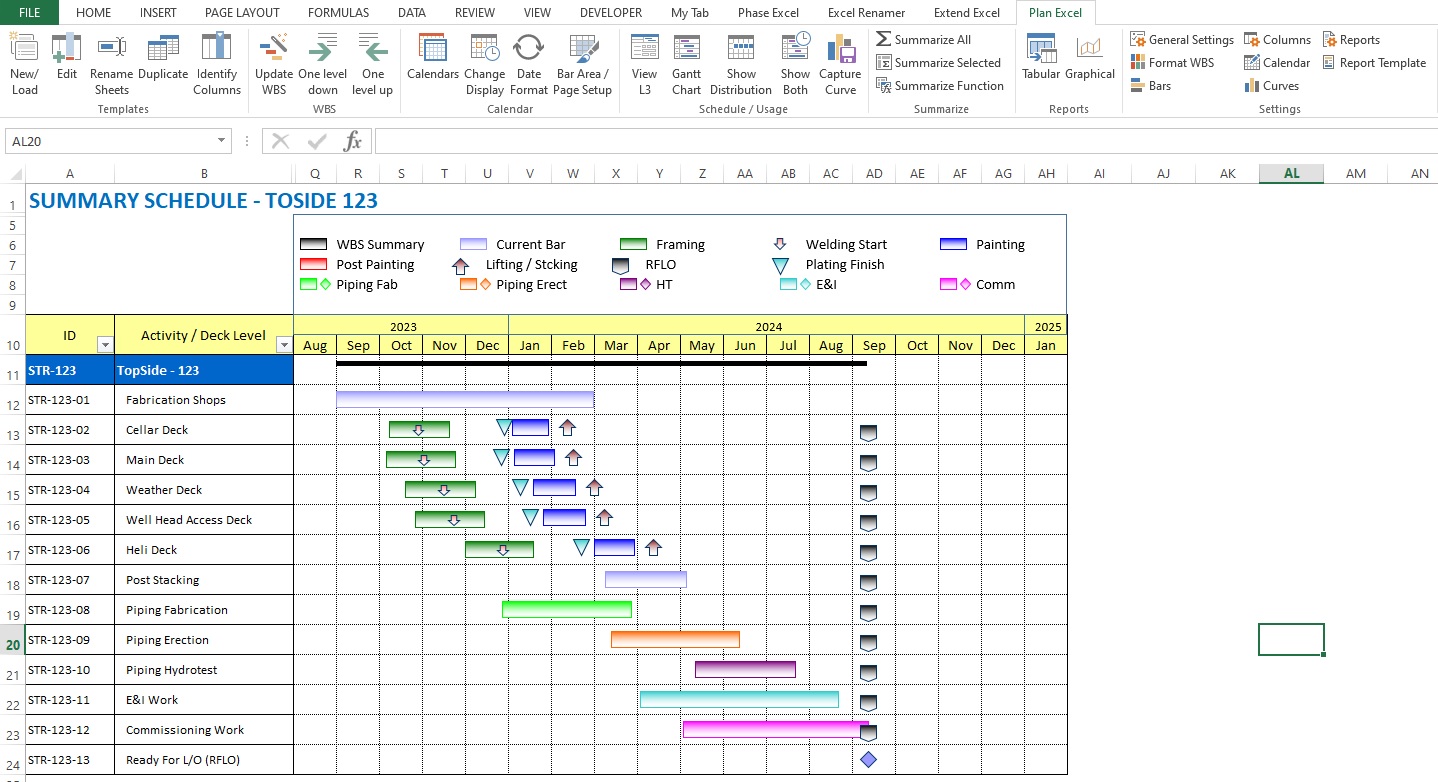
- Depict scenarios visually using the multiple bar options to show events and milestones.
- Create summary schedule for easy discussions and review.
2. Activity & Milestone Management
- Display both activities and milestones clearly on the timeline.
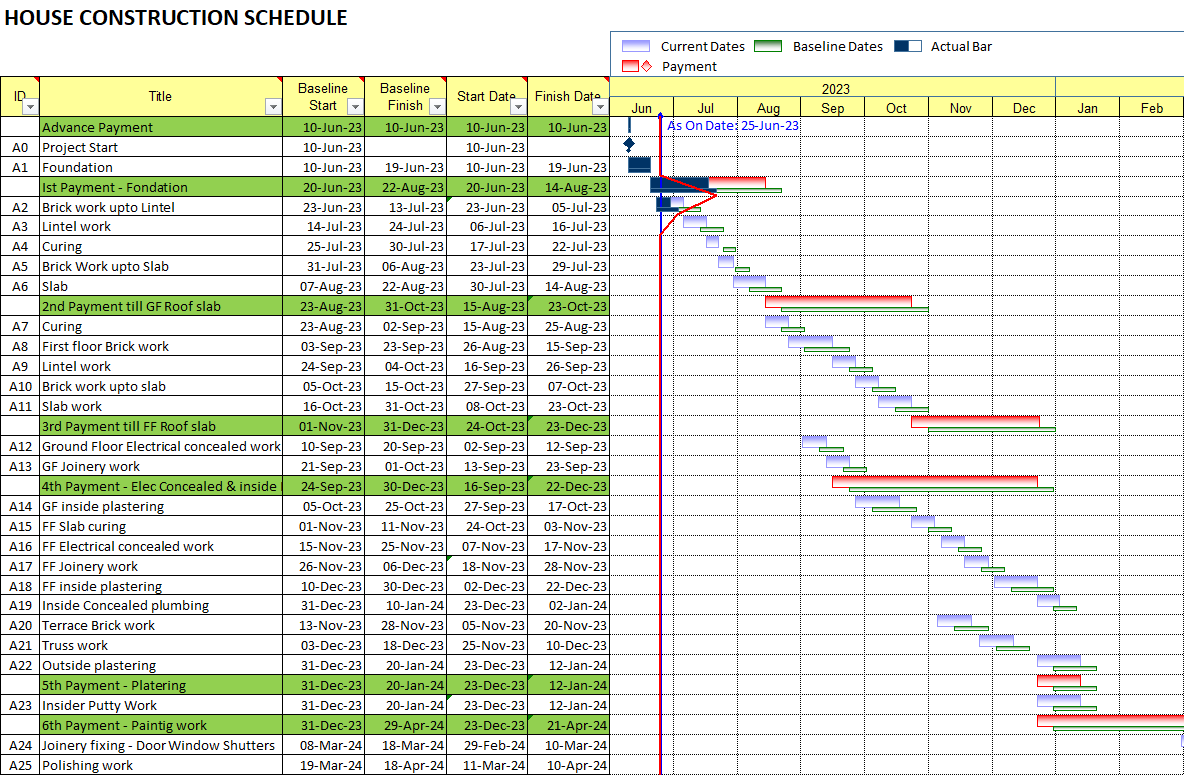
- Monitor progress with comparisons between current/forecast dates Vs planned dates.
- Draw multiple bars to represent various phases or date-based events.
- Visualize event impacts to highlight potential delays and their consequences.
3. Resource Management & Usage Analysis
- Allocate resources based on assigned calendars to manage workloads efficiently.
- The tool embeds calculations directly into custom pivot tables, enabling dynamic scaling and factoring. This transforms raw resource usage data into meaningful insights, helping users make informed decisions.
- Effortlessly drill down from high-level summaries to individual activities, uncovering detailed insights from any grouping or category. This feature ensures seamless traceability and enhanced visibility into resource allocation and performance.
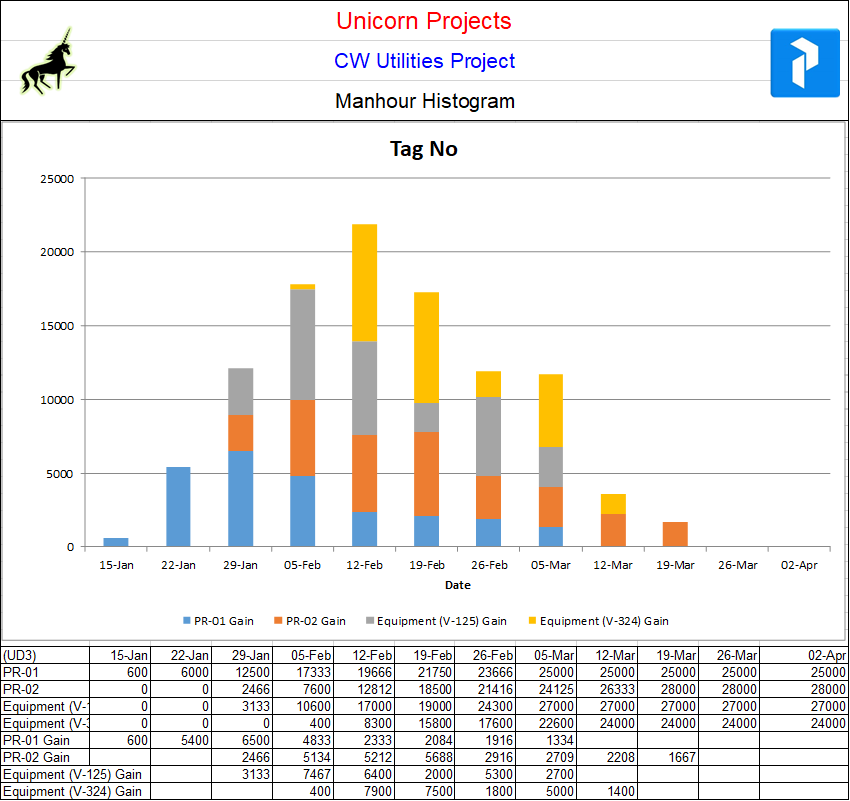
- Summarize resource usage with easy-to-read histograms.
- Assign distribution curves or create a new one to assign for resource usage.
4. Plan / Actual / Forecast Monitoring
Track and manage performance effectively with the Plan / Actual / Forecast utility. This feature enables users to:
- Create and Monitor Quantitative Plans
- Build detailed quantitative plans and seamlessly convert them to add actual values and forecasts based on real-time performance.
- Generate Accurate Forecasts
- Leverage past performance data to create reliable forecasts and adjust plans proactively.
- Summarize and Group Data by Custom Codes
- Aggregate and organize multiple quantities using custom codes for better clarity and reporting.
- Track Actual vs. Planned Performance
- Monitor actual outcomes and compare them against both planned targets and required future performance to stay on track.
5. Work Breakdown Structure (WBS) Creation
- Categorize tasks effectively by creating a hierarchical WBS.
- Use WBS for better task management and resource allocation.
- Easily recreate schedules in Primavera or Microsoft Projects Schedules directly in Excel similar to with a Primavera P6-style format. Use the Plan Excel Add-in to apply P6/MSP WBS Format on data extracted from a P6 schedule. Simply copy and paste the P6 schedule data into Excel, and the add-in will seamlessly organize and format it for enhanced visibility and reporting.
- Analyse the Primavera or Microsoft Projects schedule using PlanXcel built in tools for easy analysis and dynamic report generation.
6. Reporting & Analysis
- Generate comprehensive tabular reports for progress tracking and date variance.
- Produce graphical reports, including:
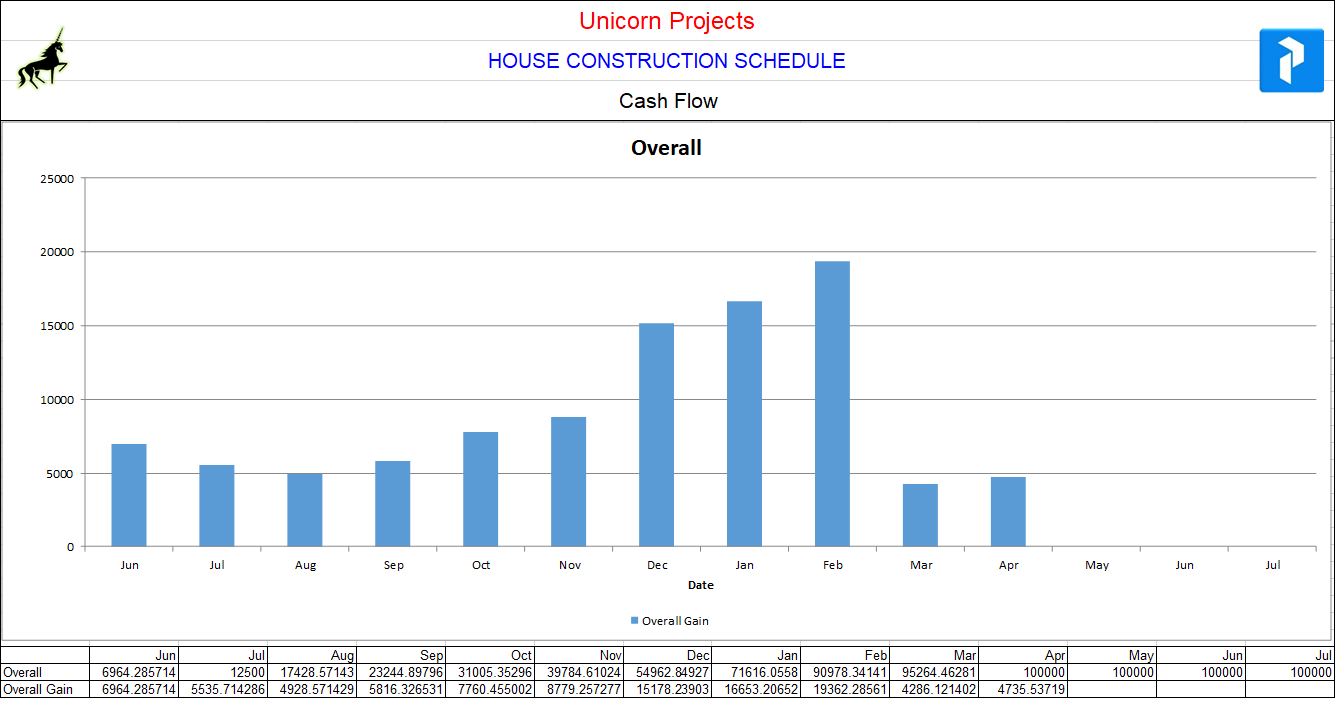
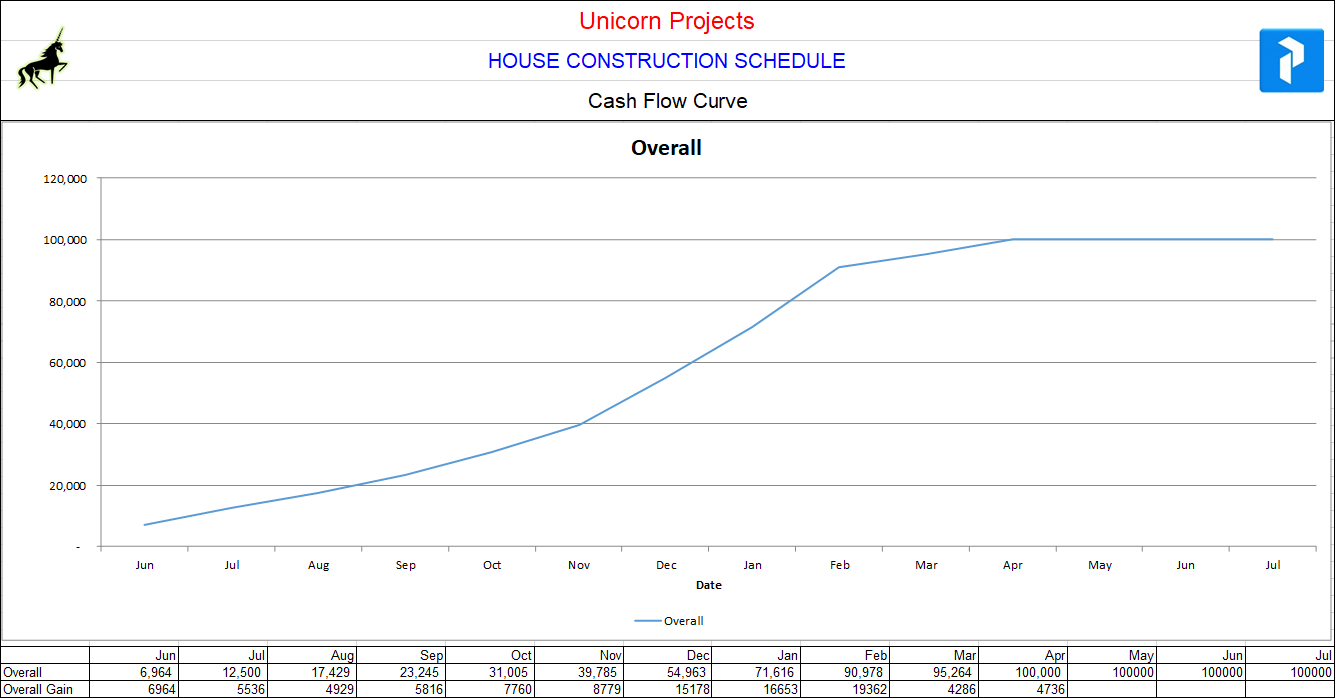
- S-Curve for cumulative progress/data
- Histograms for resource usage/data
- Drill down to activity level from the group to detailed levels in reports.
- Create dynamic charts for S Curves at any level which is an unique feature of PlanXcel.
- Create reports based on performance from the Plan / Actual / Forecast status
7. Excel Integration & Formula Support
- Utilize Excel’s native formulas to define relationships between activities.
- Access all Excel functionalities to enhance flexibility and productivity.
8. Customization & Ease of Use
- Personalize colors, styles, and other chart settings to suit your needs.
- Simple, intuitive interface designed to maximize productivity.
9. Download Options
- Download the PlanXcel_Setup.exe file for automatic installation
- Download the PlanXcel.zip file for manual installation
PlanXcel Ribbon Menu

Sample Schedules
Reports Samples
After the Download is completed, Extract the zip file to a New Folder. Open Install_PlanExcel.xlsm file and follow the On screen commands to complete the Installation.
Caution: Directly opening the Install_PlanExcel.xlsm file without unzipping may show that the Installation is successful but may result in partial Installation only. So always extract and then open the Install_PlanExcel.xlsm file.
